When it comes to sales, most people don’t immediately think of concepts like data collection, metrics, or analytics.
When most people think of sales, they picture an upbeat, maverick salesperson who woos customers on the golf course through sheer wit, charm, and natural instinct. In reality, this fast and loose approach to sales is losing out to a more methodical approach.
Like everything else in business today, sales is quickly evolving. Sales organizations today are incorporating new technologies and data analytics capabilities to help them adapt to these rapid changes.
This new, systematic, data-driven approach helps salespeople hone their skills, check their gut instincts against hard data, and leverage technology to automate repetitive tasks, become more efficient, and close more deals in less time.
More importantly, business leaders can now rely on data and advanced sales analytics in order to make smarter decisions, rather than basing important business decisions on mere guesswork and intuition.
That’s not to say that there’s no art to the process of selling. Salespeople must still be people-oriented, engaging, and charismatic. They must be able to think quickly on their feet, be sympathetic to the needs of their customers, and be highly-aware of the logical and emotional motivators of each stakeholder involved in the buying process.
While these “soft skills” are still valuable and necessary, increasingly, the organizations that refine their selling practices using hard data end up coming out ahead. Relying on imprecise methods of decision-making leaves you vulnerable to disruption by smarter, more data-savvy competitors, no matter what industry you’re in.
In order to continue driving higher revenue and profits, you must be able to identify and collect data on the right sales metrics that can help you spot risks and opportunities for growth.
“Everybody gets activity metrics at this point. I think that’s an old story. What you’re seeing people do a better job of — though it’s still not good — is really understanding which metrics are making a difference.”
Fortunately, a sales analytics program is relatively easy to set up, and it can deliver drastic profit increases by improving decision-making, increasing efficiency, and expanding your capacity to satisfy more customers and close more deals.
It should come as no surprise that sales organizations that rely on metrics, data, and analytics outperform the competition in all areas.
According to research by McKinsey Global Institute, data-driven organizations achieve a significantly higher likelihood of above-average performance across the entire customer lifecycle:
Source: McKinsey Global Institute
In addition, McKinsey found that data-driven companies are:
Source: McKinsey Global Institute
McKinsey also found that 53% of fast-growing companies rate themselves as effective users of analytics.
Source: McKinsey & Company
However, even though most business leaders now realize the importance of being data-driven, McKinsey’s research also found that most sales organizations today (57%) still do not view themselves as effective consumers of advanced analytics.
If you feel like your organization is beginning to fall behind, you’re not alone. Several measures of average sales performance have been declining steadily nationwide.
According to the 2017 CSO Insights World-Class Sales Practices Report, the average quota attainment was 63% for U.S. salespeople in 2012. That’s across all geographies, industries, and company sizes.
In addition:
While most sales organizations continue to struggle, there is a small group of organizations that continue to buck the average trend, and are being rewarded very well for doing so.
Here are the 5 things that set top-performing sales organizations apart from their competitors:
Data-driven companies are 5% to 6% more profitable than their competitors, according to research from McKinsey.
The days of relying on intuition and guesswork to make important business decisions is over.
While high-performing sales leaders do use the intuition they’ve developed from experience, they also understand its limitations. They know that reflexive decisions often spring from bias, and bias often leads to bad decisions.
They see sales data as one of their most valuable management tools.
And, in order to make sure their sales metrics are always accurate and up to date, they get data delivered automatically.
While they understand that sales is a people-oriented art form, high-performing sales organizations also make sure that everything they do is informed by data, and carried out in an orderly, systematic manner.
World-class sales leaders see their organization as a team, not a group of solo performers.
If their sales team isn’t producing the results it should, they look for ways to improve the system. They don’t seek scapegoats.
They use technology to capture sales data and measure sales metrics from many sources, including email, phone calls, social media, and other sources.
Because of this, the data is always accurate. It’s not distorted by the agendas of individual sales reps.
With better data, they can make better decisions. They know their executives and board members are likely to trust data-based recommendations over intuition or gut-level guesses.
They invest in coaching and training. They provide coaching that’s based on key sales metrics and custom-tailored to the needs of individual sales reps.
They use key sales metrics to help ensure that customers get the right level of attention. They ensure that salespeople provide the right information at the appropriate time.
If a sales rep leaves the team unexpectedly, they use existing sales data to inform the next person who becomes responsible for the account, ensuring continuity and consistency.
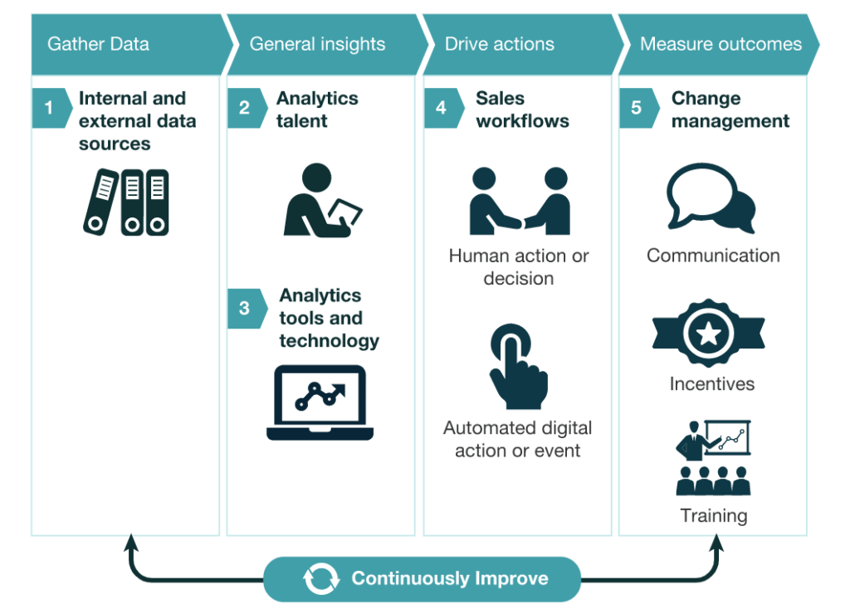
Oftentimes, even if an organization does realize the importance of collecting data to measure key sales metrics, it’s still incredibly difficult to figure out exactly how to sift through all that raw data, make sense of it, and put it to good use.
To help you brainstorm different uses for data in your own organization, we’ve compiled a list of 10 ways top-performing sales organizations are utilizing their sales data and key sales metrics to generate more revenue and outmaneuver their competitors:
In order to remain competitive, you must be able to quickly adapt to changing marketing conditions, trends, and customer demands. In such a dynamic, fast-moving business environment, a well-designed sales analytics program could easily become your competitive advantage.
Reliable data allows you to accurately predict changes in the marketplace. With this foresight, you can disrupt your own organization, leverage the latest technology to create innovative, new business models, and better meet the needs of your customers before a more nimble, data-driven competitor does.
In every industry, the winners of the future will be the organizations that can leverage data to identify market changes quickly and be the first to respond with solutions that best meet customer needs.
One of the most obvious benefits of tracking sales metrics is the ability to predict future sales based on historical data. Unlike ambitious goal-setting, historical data gives you an accurate and realistic picture of how much revenue your team should be generating within a certain time period.
In addition, AI sales tools can now relate your current transactional and customer interaction data (emails, meetings, phone calls, etc.) to actual sales outcomes in order to predict future revenue to an extremely high degree of accuracy.
When you can accurately forecast what revenue will be and spot risks early, you can use that knowledge to allocate resources and manage your workforce more efficiently. In addition, cutting waste enables your organization to be more agile so you can quickly respond to changing market conditions.
Historical sales data also allows you to compare your organization’s performance to industry averages to see if you’re on track. If you discover that your sales metrics do not align with industry averages, you can now begin the process of identifying the root cause and making the necessary corrections.
One of the more advanced ways of utilizing sales data to maximize efficiency and optimize resources is to discover and fill gaps in the coverage of assigned sales territories.
Top-performing sales organizations look for signs that sales activity in each territory may either be too narrow in scope, or not deep enough in key accounts or opportunities.
They use transaction and customer data to first define each territory. Then, each territory is reviewed to ensure they have sufficient resources to meet company goals.
Once territories are defined, sales strategies are deployed, further data is collected, and territories are realigned accordingly.
By becoming data-driven, you can ensure that you are always saying the right thing, to the right customer, at the right time.
Most organizations find it extremely challenging to develop value propositions that are effective at convincing each segment of customers they target to buy from them. While most companies opt for a one-size-fits-all approach, data-driven companies are able to test many different value propositions on different segments of customers to identify which are the most effective.
By collecting and cross-referencing many data points, it’s possible to build highly-personalized value propositions tailored to the specific needs of each customer segment.
Another challenge is setting the price of new products and services to ensure maximum sales and revenue. Using market data and dynamic-pricing engines, companies can test many different price points to determine what the optimal price is for each solution, and even for each segment of customers.
Some companies have discovered that, in order to maximize revenue, they actually needed to raise prices. While price increases may cut the number of potential sales, by growing the average size of each sale, you may be able to achieve an increase in overall revenue.
Sales metrics provide many valuable insights that your organization can use to cut costs and improve your product offerings.
By analyzing transactions, you can spot products whose sales are under-performing overall, or under-performing in certain customer segments. Then, you can investigate why they are under-performing, and use the feedback from customers to refine products to better meet their needs.
In addition, you might determine that some products are no longer worth producing or supporting. By cutting these under-performing products, you can decrease costs, and focus more time and resources on products that drive the most revenue and profits.
By tracking and analyzing the right sales metrics, managers can be more effective at correcting performance issues, setting realistic sales goals, incentivizing high performers, and motivating their team.
When sales managers have reliable data, they can create a sales forecast for each, individual sales rep, and compare their current performance to their performance in the past.
If a sales rep has unusually low performance, sales managers can focus more time on coaching and training that sales rep.
On the other hand, if a sales rep has unusually high performance, sales managers can now acknowledge and reward that rep’s hard work.
According to research by Esteban Kolsky, 67% of customers report bad experiences as a reason for churn, but only 1 out of 26 unhappy customers complain.
Many companies use historical customer data to identify the top factors that cause customers to churn, and spot at-risk accounts so they can proactively reach out to those customers to address their concerns and make sure they are thoroughly satisfied.
In addition, you can analyze your transactional data to identify large and growing accounts so that you can focus on taking care of them to ensure the highest customer satisfaction and retention rates possible.
This also includes identifying customers who have signed up for a trial of your product, but haven’t begun using it. When you are able to identify these accounts in the trial stage, you can reach out to them, offer assistance or tutorials, and help them immediately see the full value of using your product.
By comparing customer data to transactional data, you can identify which products and services each of your leads is most likely to be interested in.
You can also identify highly-relevant, new products to recommend to your existing customers based on the kinds of products they’ve purchased in the past.
According to McKinsey, a full 35% of purchases on Amazon come from these kinds of highly-personalized product recommendations.
By analyzing demographic, transactional, and customer interaction data, you can now segment leads in your pipeline based on how profitable they are likely to be and how engaged they are (an indicator of how quickly they are likely to close).
Instead of wasting time reaching out to leads that aren’t likely to be interested in your products, AI algorithms can now use your sales data to generate a list of the most viable and profitable opportunities to contact first.
This data can also allow you to identify and fix weak points and bottlenecks where leads are getting stuck in the sales process, or falling out of your pipeline completely.
By utilizing data to improve the targeting of your advertising efforts, you can avoid wasting money targeting customers that aren’t likely to be a good fit for your company.
Based on data points you have on your most profitable customers, you can now target and acquire more customers only if they exhibit similar behaviors and characteristics, maximizing the return on your marketing spend.
Over time, you can also gather data on which types of marketing collateral is most effective at converting different types of customers. You may learn that some customers prefer short, concise sales presentations, and other customers prefer more in-depth, detailed demonstrations of the product.
All of this information can be used to tailor your marketing and sales efforts, reduce waste, cut down the sales cycle, and drastically increase revenue and profits.
While these words are often used interchangeably, it’s important to understand the difference between each concept, as they are all very different from one another.
Metrics are the various aspects of your business that you choose to measure in order to determine how well you’re performing.
Metrics in business are similar to health markers in medicine. A doctor can choose to measure all kinds of “metrics” about your body, They can even use precise medical instruments to collect highly-accurate data on all of those metrics.
However, only a portion of those metrics (such as blood pressure, BMI, cholesterol levels, etc.) are truly useful for determining whether your body is healthy and functioning well. By measuring these key metrics, you can use the data to guide you toward reaching your health goals.
In the same way, the key to achieving your business goals is to always be measuring the right metrics, and make sure you are collecting accurate data on each of them.
Care must be taken not to base important business decisions off of misleading “vanity” metrics that might sound good on paper, but don’t actually give you an accurate idea of your organization’s performance.
Each individual business must decide which metrics are meaningful and indicate that their organization is on track to reaching their goals.
There is a special subset of metrics that are especially strong indicators of whether or not your organization is performing well. This subset of metrics are commonly referred to as “Key Performance Indicators” (KPIs).
According to OnStrategy, there is a small, but important distinction between metrics and KPIs:
“Metrics and KPIs are often confused, but the clear difference is KPIs are the key measures that will have the most impact in moving your organization forward. They clearly articulate and provide insight into what your organization needs to measure and achieve to reach your long-term objectives. Great strategic plans have 5-7 clear Key Performance Indicators that keep the pulse on how you’re performing against your plan.
It’s easy to use the two terms interchangeably, but here is a good way to think about it. Key Performance Indicators help define your strategy and clear focus. Metrics are your “business as usual” measures that still add value to your organization but aren’t the critical measure you need to achieve.”
Source: Adobe.com
According to LevelEleven’s post titled What is a Sales KPI? (You Might Have it Wrong), a KPI is really 3 things: “an instrument to help you meet your end goal, it’s trackable and monitored on a regular basis, and it’s a tangible piece of data to indicate you are headed towards your desired outcome.”
While you can choose which metrics and KPIs to measure, and what your goals are for each, you can’t choose your data. The data just is what it is.
For example, let’s say one of the metrics your sales team has chosen to measure is how many SQLs are converted to Closed Deals each month. They’ve chosen a 10% close rate as their goal.
Last month, they only had an 8% close rate, missing their goal by 2%.
While the metrics, KPIs, and goals you choose to measure may change, that data (8% close rate) remains unchanged.
If one of your sales reps converted several SQLs into closed deals, but never recorded that data in your CRM, your metrics will now be incomplete and no longer accurately represent reality. This would completely throw off your projected revenue, and any decisions made based on that projected revenue will be flawed.
That’s why it’s vitally important to make sure that the data you are collecting on each metric are as accurate and complete as possible.
If metrics are “what” you choose to measure, then analytics is the “so what?”
Analytics consists of thoroughly examining all of your metrics in order to identify patterns and glean insights that can be used to guide your decision-making in the future.
While there are nearly limitless amounts of different metrics you can track in your organization, it’s important to try to cut through all the noise, and only focus on the KPIs that matter the most.
When trying to brainstorm ideas for which metrics and KPIs to track, we’ve found that it’s helpful to look at what other sales organizations are tracking, and what they’ve found to be most helpful when it comes to guiding performance management and decision-making.
The LevelEleven research team sought to answer that very question by analyzing 3,000+ KPIs being used by 800+ sales teams.
As you might expect, the most commonly used KPIs differ by selling role (inside sales, field sales, hybrid sales, sales development and account management).
Here are the top KPIs by selling role, in order of popularity:
If you need even more sales KPI ideas, HubSpot has put together a fairly exhaustive list here.
According to LevelEleven’s research, sales leaders set goals and monitor KPIs using different time frames (i.e., monthly, weekly, or quarterly goals) so they can stay on pace and course-correct in the moment, if necessary.
Here are the most common KPI goal time frames uncovered by their research:
Source: LevelEleven’s Sales KPI Report
Expert Advice:
“You need to be able to measure the KPIs you choose, meaning the data must actually be available and accessible. Each employee should be able to track their own progress and management should be monitoring them for weekly, monthly and quarterly progress. This should lead to coaching opportunities that will ensure that the appropriate praise or corrective measures are taken in the near term instead of finding out you have issues too late.”
Sales organizations who successfully implement a sales analytics program typically follow 4 steps to identify which sales KPIs are the most valuable and meaningful for their specific needs and objectives.
Each role within your sales organization has different responsibilities and goals; therefore, each role needs different KPIs to guide them toward success.
While some of these KPIs might overlap, you will still need to divide up your sales organization by role, and determine which KPIs are the most useful for each.
For this first step, we recommend drawing out a rough org chart, such as this one:
Source: Lucidchart
Once you’ve drawn out your org chart, it’s time to start gathering input from different team members on what kinds of activities they think contribute to success the most. These activities will form the basis of the metrics and KPIs your organization will begin measuring when you implement your sales analytics program.
In addition to discovering ideas for sales metrics you may not have thought of on your own, this process has the additional benefit of involving your team members in the process and making them feel invested in the outcome. Once you implement your sales analytics program, this feeling of investment will go a long way towards ensuring successful buy-in from each member of your team.
As you conduct your interviews, keep an ongoing list of all of the activities that your team believe most contribute to their success that you can then develop into metrics, KPIs, and goals to track.
Once you are finished compiling this list, begin sorting them into one of two categories: leading indicators or lagging indicators.
LevelEleven defines leading vs lagging indicators this way:
“Lagging indicators measure the result of what came before it — for example, closed sales, average deal size and sales cycle length. It’s a measure, but you can’t really do anything about it anymore because it already happened.
Leading indicators, on the other hand, are measures that reveal whether you are headed towards achieving your desired result, and ideally, they’re controllable. If you are behind on a leading indicator, you can change your behavior to affect the result.
For example, if your lagging indicator goal is higher deal sizes, a leading indicator may be that you are completing ROI evaluations with decision makers, or are always including a certain add-on product to your proposals.”
Source: HighDefinitionBanking.com
A simple way to think of it is that leading indicators are the activities you perform (phone calls, emails, quotes and proposals, demos, etc.), and lagging indicators are the outcomes of those activities (leads generated, opportunities created, deals closed, etc.).
The purpose of making the distinction between these two categories is to identify which activities your team members are performing (leading indicators), and then measure how those activities contribute to your goals (lagging indicators).
By turning these leading and lagging indicators into KPIs, setting goals for each, collecting the data, and analyzing the results, you can then identify areas where further training, coaching, or resources are needed to maximize your team’s performance.
Whether you are rolling out your sales analytics program for the first time, or your organization’s needs have changed and you need to overhaul your KPIs, you won’t know exactly which KPIs are the best for each role without a bit of “guess and check”.
When using a data-driven approach to sales, it’s helpful to keep in mind the scientific definition of a “hypothesis”, which is simply an educated guess that you then test to determine its accuracy.
Using your current knowledge of your sales organization, combined with the input you’ve gathered by interviewing team members, and LevelEleven’s research on the most commonly used sales KPIs, you can begin making educated guesses on which KPIs will be best for each role in your sales organization.
You don’t need to spend a lot of time or worry about making mistakes during this stage. The most important thing is to start with a handful of KPIs, start gathering data, and then review the results so you can adjust accordingly.
Based on their research, LevelEleven recommends selecting 3-4 leading indicators and 2-3 lagging indicators for each role in your sales organization to focus on as your KPIs:
“Selecting too many measurements will result in a lack of focus. Don’t overwhelm people with numbers and information — this process is supposed to help them prioritize and succeed.”
Once you’ve refined your list of KPIs, present them to the members of your team that you interviewed, explain your reasoning, and ask them for their input. You want to make sure that the KPIs you selected make sense in the context of your team’s current sales process, workflows, and objectives.
Once you get sufficient agreement on which KPIs to align your team around, it’s time to begin implementing your sales analytics program, measuring the results, and revising and adjusting where necessary.
Expert Advice:
“I tell sales leaders to have 3-5 KPIs, tops. There’s such a bias or inclination or gut reaction toward measuring this and that and the other thing, and suddenly the list becomes 8-10 things. And you can’t focus on all of those. They key to making the whole introduction and maintenance of KPIs successful is having the right number of them.”
Now that you’ve selected the KPIs you want to measure, and set goals and time frames for each, it’s time to implement your analytics program and start collecting data.
According to research by McKinsey, successful companies take 5 specific actions in order to implement an effective sales analytics program:
Source: McKinsey & Company
The first step is to begin allocating time and resources toward data collection, both internally, and from external sources.
The second step involves acquiring talent with advanced data science and analytics skills who can translate insights into actionable guidance for reps in the field.
The third step is to implement low-cost analytics tools, many of which can be deployed quickly and easily from the cloud.
Sales Force Automation (SFA) tools like ZynBit work transparently in the background to record 100% accurate sales activity data and automatically sync it with your CRM, freeing your team to focus on more important activities.
Fourth, begin embedding analytics into pre-existing sales tools (such as the CRM system) and related processes.
In addition, identify sales activities and processes that don’t generate revenue. Look for ways to reduce, delegate, or eliminate them.
Finally, in order to maximize adoption, insights must be accompanied by clear communication, incentives, training, and performance management.
Help your sales team see how their activity data makes them more successful. When they see how the data helps them succeed, they’ll be much more likely to adopt and utilize the new tools and processes you’ve provided to them.
Expert Advice:
“Expectations, goals and quotas need to be set before you roll out KPIs. Everybody knows their expectations, goals and quotas, as well as when they’re going to be reviewed. If they understand that in roll out, I’ve found that it makes that a lot easier.”
“Adding sales metrics is healthy and should make sense to the reps that are using and tracking them. If they understand how the metrics help shape their behaviors and activities, they are more likely to embrace them.”
Many businesses are learning that harnessing their data and reaping the benefits is more difficult than they first imagined, due to the sheer amount of data being collected.
By 2020, the number of digital bits of information stored on the web will reach 44 trillion gigabytes, according to EMC.
This rapid explosion of data has led companies worldwide to begin hiring Data Scientists as fast as they can in order to make sense of it all.
According to the Harvard Business Review, Data Scientists are “a high-ranking professional with the training and curiosity to make discoveries in the world of big data”.
Unfortunately, the August 2018 LinkedIn Workforce Report found that there was a shortage of more than 151,000 people with data science skills nationwide, with “acute” shortages in New York City, San Francisco, and Los Angeles.
The lack of data science talent is causing serious constraints to organizations, not only in the U.S., but worldwide.
Fortunately, new technologies are being developed to fill these gaps and not just help organizations tame their large stores of data, but turn them into valuable insights that can increase performance, efficiency, and profitability
One of these new tools is Salesforce’s Einstein AI.
Salesforce summarized the capabilities Einstein that provides in a blog post introducing the new technology:
“Powered by advanced machine learning, deep learning, predictive analytics, natural language processing and smart data discovery, Einstein’s models will be automatically customized for every single customer, and it will learn, self-tune, and get smarter with every interaction and additional piece of data. Most importantly, Einstein’s intelligence will be embedded within the context of business, automatically discovering relevant insights, predicting future behavior, proactively recommending best next actions and even automating tasks.”
One way of thinking about Einstein is that it’s like a “Smart Assistant” that works in the background to perform time-consuming tasks, find connections in your data, provide actionable insights, and ensure that each member of your sales team is able to make the right decision, at the right time, based on data.
Salesforce lists the following benefits of utilizing Einstein:
With Einstein, the benefits of data science and AI are no longer restricted to highly-skilled data experts, or large organizations with enough capital to develop their own Artificial Intelligence programs.
Salesforce aims to “democratize” data science and AI, so that business people of all kinds “can direct the analysis without having to fight for scarce data-science resources. Suddenly hundreds — or even thousands — of business users can run their own analyses, unlocking their own opportunities for improvement.”
While Salesforce’s Einstein AI looks incredibly promising, there is one critical problem that can not only cripple the value you are able to get out of tools like Einstein, but can also cause your entire sales analytics program to fail.
That problem is this:
So, how will you get your sales reps to accurately and thoroughly collect all of the critical data from their sales activities and customer interactions (such as calls, emails, texts, meetings, etc.), and then manually enter all of this data into your CRM?
Without this data, not only is advanced AI technology like Einstein rendered useless, but your entire sales analytics program is put into jeopardy.
Unfortunately, even with the best of intentions and the right steps in place, many organizations encounter problems in places they least expected.
Most sales analytics programs don’t fail because of a lack of advanced technical skill or the growing complexity of their tools and algorithms.
They fail because of basic, fundamental, human reasons.
You can only derive valuable insights from your sales activity and customer interaction data if you’re collecting it in the first place. This is where the biggest challenge lies for most sales organizations.
The process of manually entering this into a CRM such as Salesforce is often extremely tedious and frustrating, decreasing the chances that your sales reps will actually take the time to do it.
In fact, sales professionals cited manual data entry as their #1 biggest challenge to using their CRM, according to HubSpot’s State of Inbound: Sales Edition Report.
Source: HubSpot’s State of Inbound: Sales Edition Report
The report goes on to state:
“Data entry time negatively correlates to user satisfaction. Practitioners and executives alike prefer time spent selling to time spent on manual tasks that software should help avoid….”
There’s no wonder why only 40% of sales updates are ever entered into the CRM, on average, according to ActiveCampaign. Even when data is entered into the CRM, there’s no telling how accurate it is. Even small typos by hurried salespeople can ultimately add up to major errors down the road.
Unfortunately, even cutting-edge technologies like Salesforce’s Einstein AI aren’t capable of forcing your sales reps to collect and manually enter this data in a thorough and accurate manner.
Because critical sales data isn’t being tracked in any kind of systematic or consistent way, business leaders are too often forced to make strategic decisions based on poor data, guesswork, or intuition.
While getting sales reps to enter accurate and thorough data is an uphill battle, you simply can’t afford to not have this data.
The only viable solution is to find a way to eliminate manual data entry entirely and make the whole process automatic. However, until recently, there has been no reliable technology capable of doing this.
Fortunately, Sales Force Automation (SFA) tools have become extremely helpful at automatically handling all kinds of mundane, tedious administrative tasks.
According to SiriusDecisions:
“These improved systems are capturing information automatically so that reps spend less time doing data entry, and they’re analyzing the data they capture to help reps target the best prospects and accounts, offload tasks such as calendaring, and guide reps using insights from the SFA data. SFA systems are finally becoming a valuable tool for reps and sales operations.”
ZynBit, for example, is an SFA tool that works transparently in the background to automatically record and track 100% accurate sales activity data so your team is free to focus on more important activities, like attracting, delighting and retaining your customers.
With ZynBit, your sales reps can carry out their work like they normally do, sending emails, booking appointments, making phone calls, etc. As they work, ZynBit automatically tracks all of their sales activities, without them having to think about it.
By eliminating manual data entry, ZynBit gives your sales team hours of valuable time back that they can use for high-impact sales activities and coaching.
It’s like having a virtual sales assistant working behind the scenes to record events in Salesforce, book meetings, and find the data-driven insights your team needs to deliver sales quotas.
If you’re ready to see how ZynBit can help your sales organization become data-driven, sign up for your free, 14-day trial here.
Get a pdf copy of the guide on this page, defining which sales metrics are important, how to setup reliable measures and improve your sales culture.
ZynBit powers data-driven sales teams to optimize sales capacity.
ZynBit captures high-value customer interactions enabling your sales, management, and operations to understand pipeline activity, sales performance, and territory management patterns.
It integrates seamlessly with your existing sales workflows across mobile, browser, email and calendar simplifying the day-to-day of customer relationship management. At the same time, it collects meaningful customer data needed to optimize sales operations.
ZynBit makes salespeople more efficient and empowers management with valuable insights needed to run the business, improve customer acquisition and drive retention.
ZynBit. Be Data-Driven.
Sales Ready: Mobile | Salesforce Sidebar | Salesforce Sync | Meeting Scheduling | Opportunity Insights